I was tasked to collect data about a personal aspect of my life, from there I was to create a unique graph to
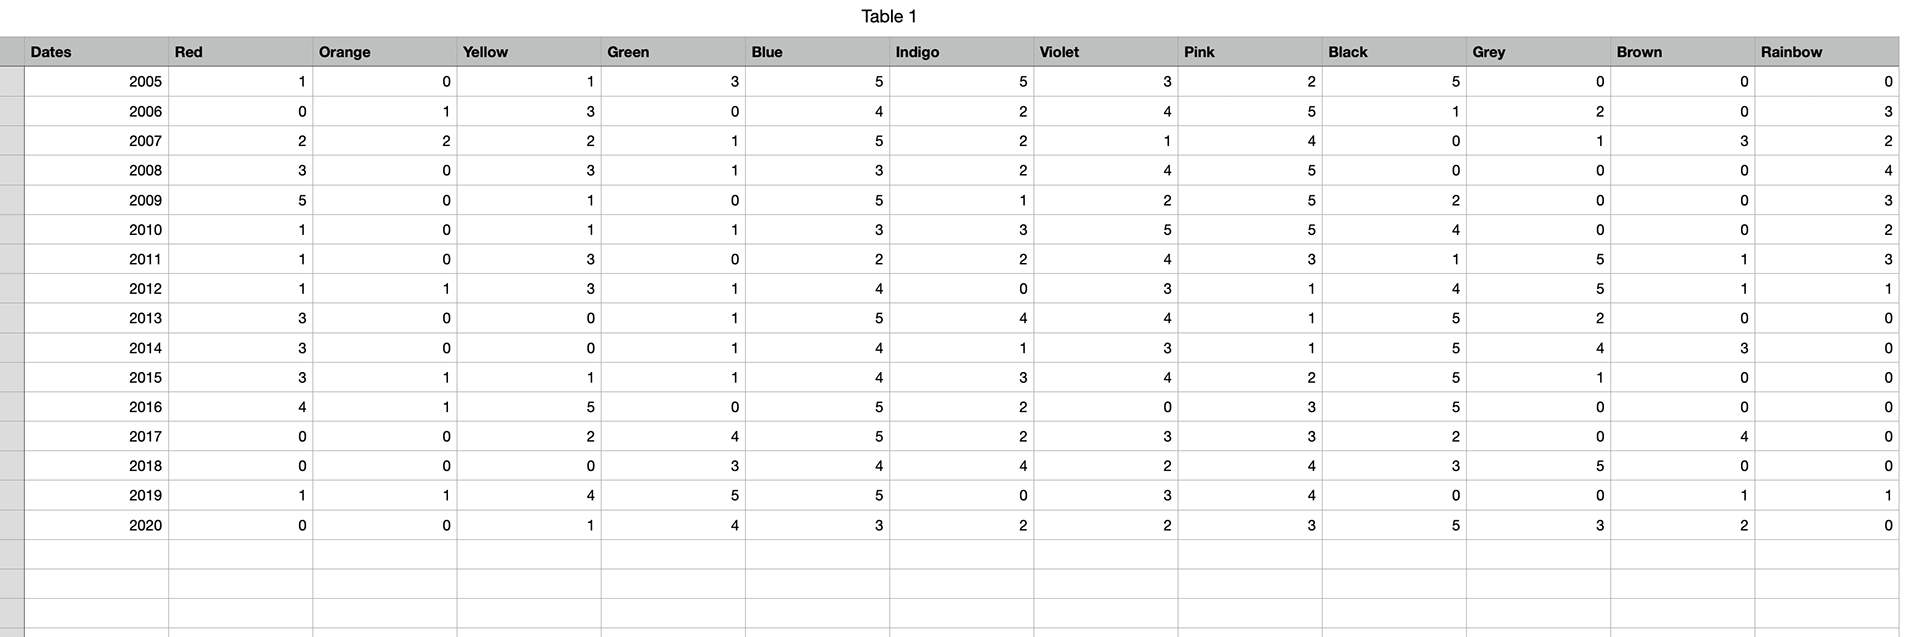
display this information. For the data collection portion, I looked through photos of myself throughout the past decade. For each year I randomly chose twenty-five images of myself wrote down the year, and the color of shirt I was wearing in the image. The Data shown in the chart below shows the trends of colors I wore throughout the decade.
display this information. For the data collection portion, I looked through photos of myself throughout the past decade. For each year I randomly chose twenty-five images of myself wrote down the year, and the color of shirt I was wearing in the image. The Data shown in the chart below shows the trends of colors I wore throughout the decade.
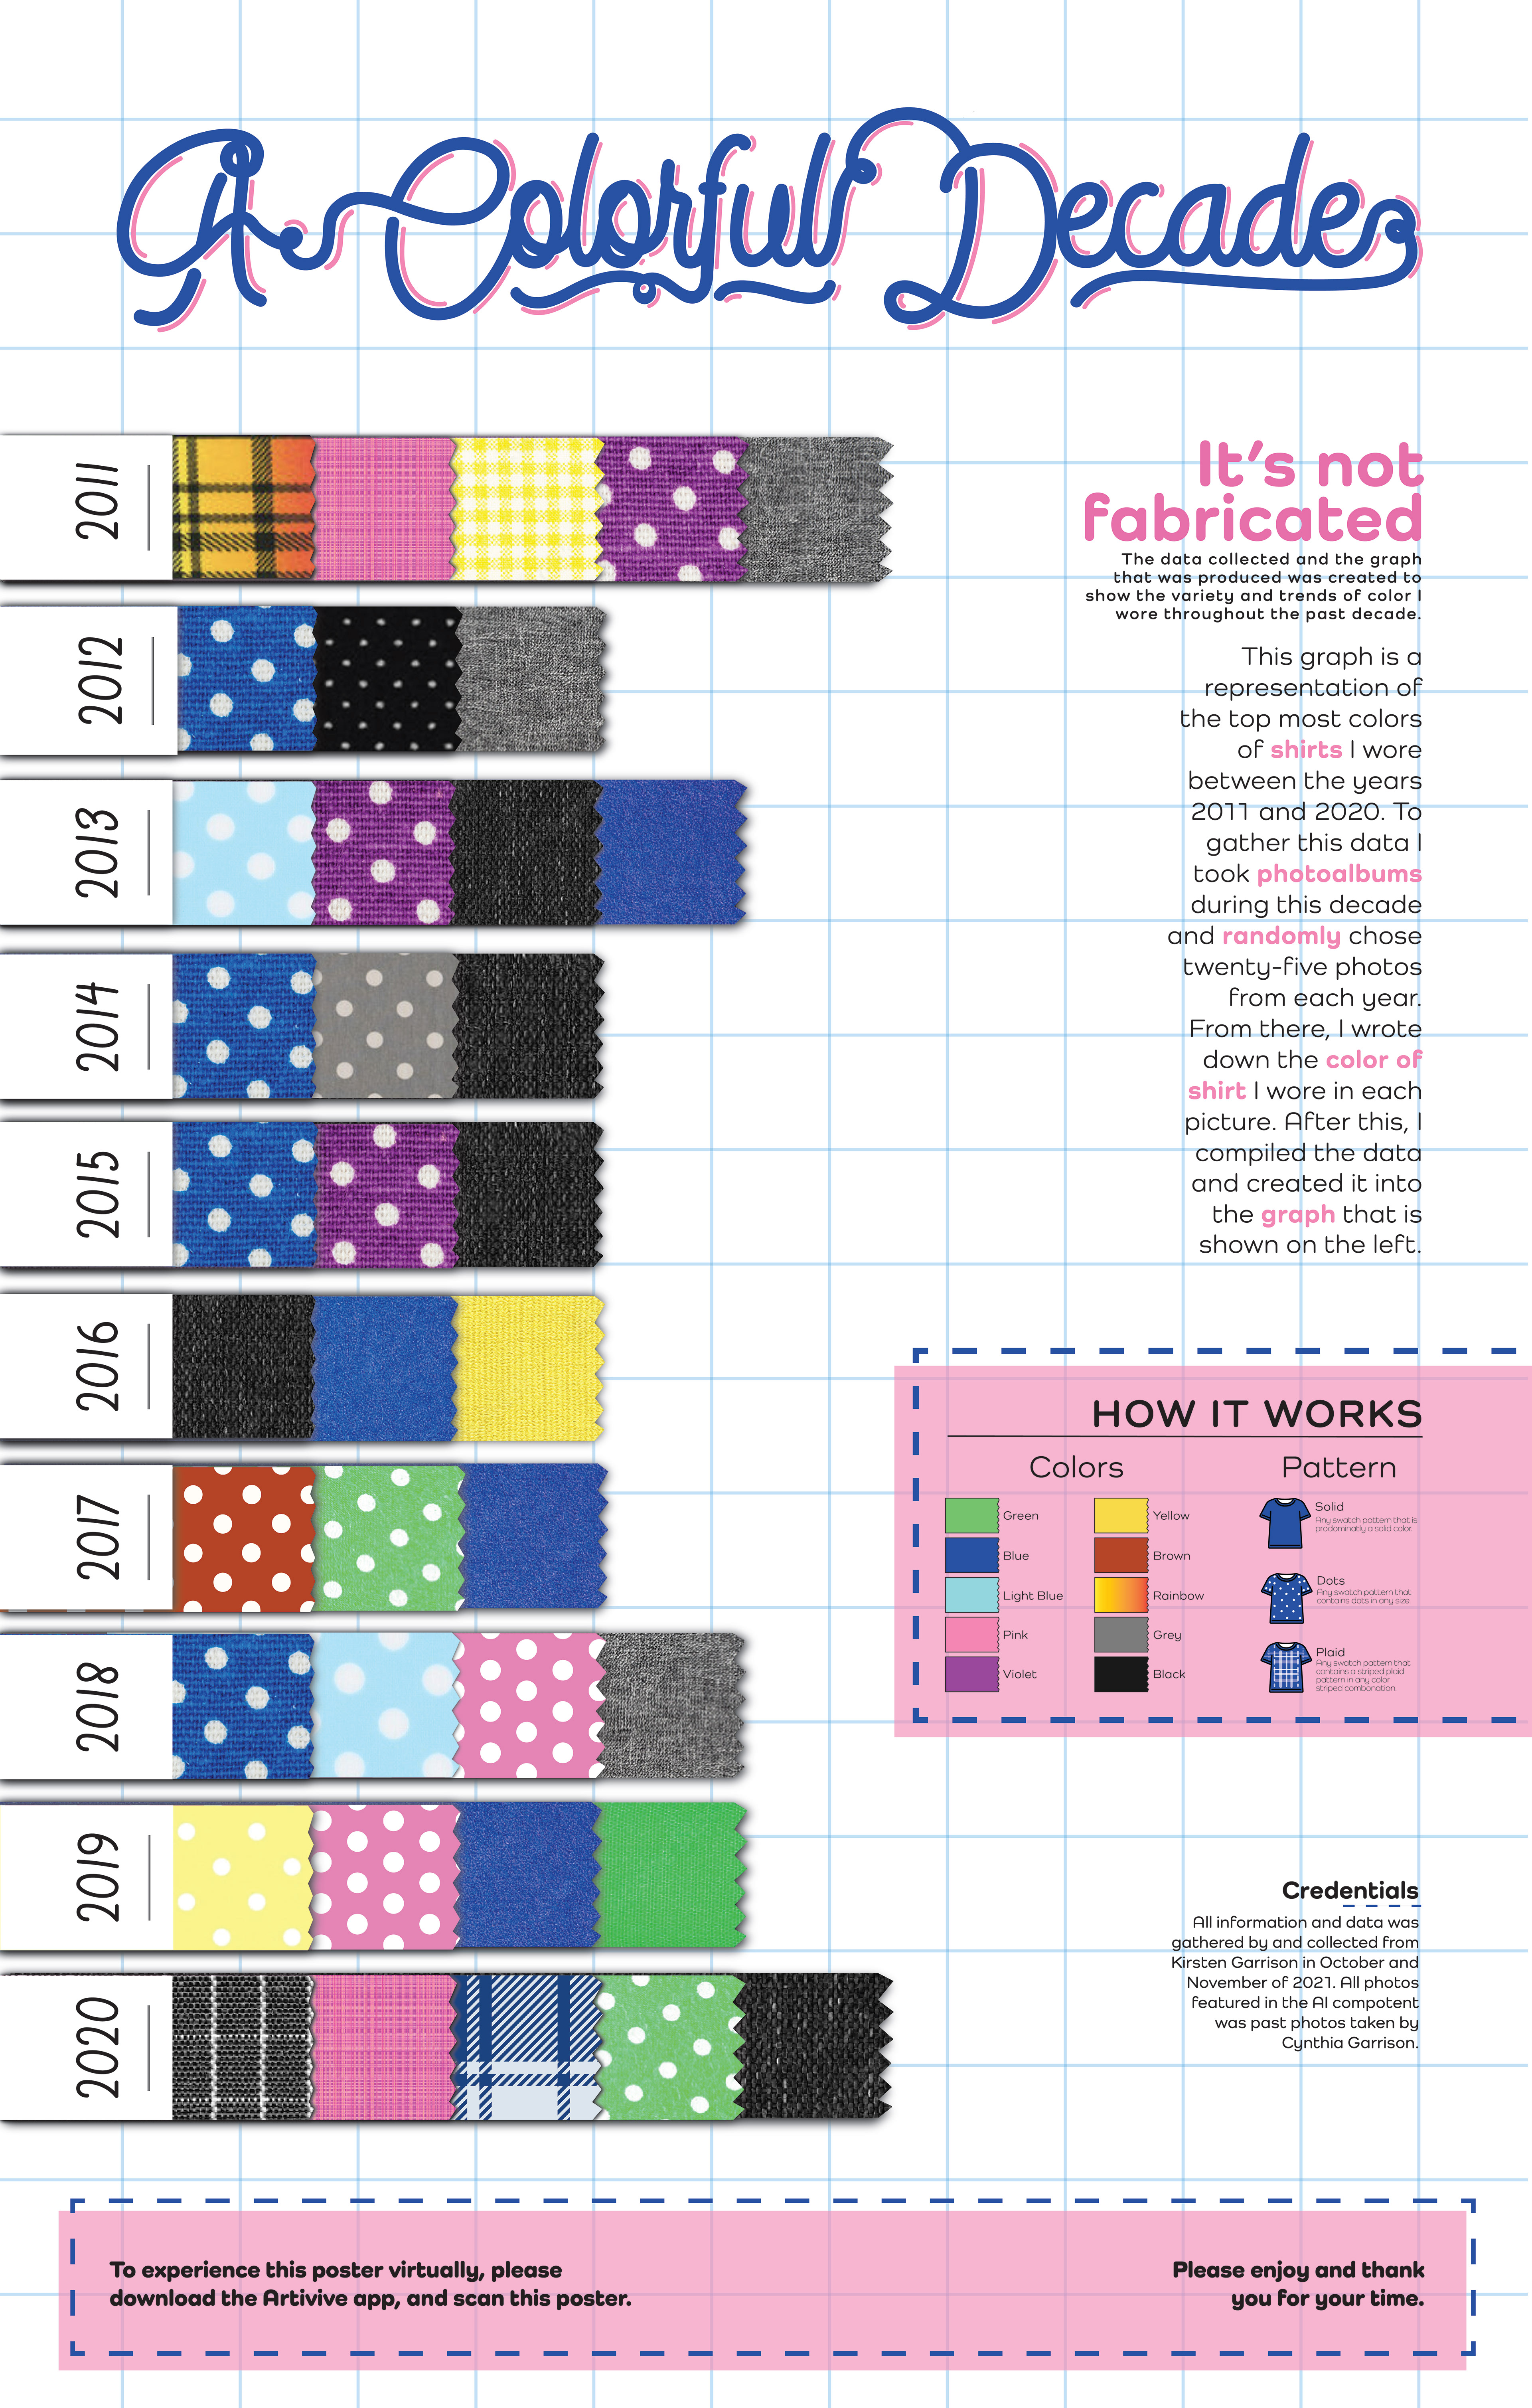
Data